Insider buying is the starting point for my stock selection. I especially favor names with bullish signals like size buying, superior insider track records, cluster buys, and insiders challenging the market crowd and sell side analysts.
Next, I examine companies to look at basics like business trends, financial strength and valuation.
To see how my system works in a bear market, I recently looked at the performance of all the stocks I suggested in my letter when the market was down 20% or more in the first half of 2020. I offer more detail below.
But here’s the bottom line:
The 84 stocks I suggested during the 2020 bear market were up 94.8% by the end of 2020, vs. 49.6% for the S&P 500. That’s 45.2 percentage points better than the market.
Some fine print: Results include dividends, and for S&P 500 performance I use the SPY ETF since that’s a common way for investors to get S&P 500 exposure. For entries, I used the initial prices on the open following publication, to exclude any impact my letter may have had on suggested stocks. I tallied results for all issues and updates published between March 15 and April 7, or all publications while there was a bear market.
Now here are the results for the full issue and individual updates.
April 7, 2020 Full Issue
Outperformance: 41.5 percentage points
My stocks: Up 87.3%
SPY: Up 45.8%
Number of stocks: 32
Stocks included a diversified array of names in biotech (17 names including BGNE, SGEN and EXAS); what I called “public gathering place stocks” like MGM and CHDN; technology; banks and finance; real estate; and energy names like XOM, LNG and CLR.
March 23, 2020 Update
Outperformance: 57.8 percentage points
My stocks: Up 131.2%
SPY: Up 73.4%
Number of stocks: 4
Stocks included DELL and FDX.
March 20, 2020 Update
Outperformance: 8.6 percentage points
My stocks: Up 77.6%
SPY: Up 68.9%
Number of stocks: 7
Included an energy name (CQP); and buyout names.
March 18, 2020 Update
Outperformance: 40.1 percentage points
My stocks: Up 102.1%
SPY: Up 62%
Number of stocks: 9
Stocks were a mix of biotech and insurance.
March 16, 2020 Update
Outperformance: 37.6 percentage points
My stocks: Up 91.4%
SPY: Up 53.8%
Number of stocks: 20
This was my Covid 19 “dream portfolio” of my system’s highest quality beaten down by Covid-related fears. Portfolio included a mix of travel-related names like DAL, SKYW, RCL and CCL; public space names like FUN and PLNT; energy names like MTDR; retailers like LOW and HD; and finance names like JPM and RJF.
March 15, 2020 Update
Outperformance: 42.3 percentage points
My stocks: Up 104.4%
SPY: Up 62.1%
Number of stocks: 12
Included a mix of energy like OXY; financial names like WHF and BHF and LOB; public space names like LYV; and aerospace names like HXL.
Like those returns? Consider subscribing to my stock newsletter here.
Macro call
Of course, to outperform the markets during a recession you have to be bullish, and not fearful like most other investors. As a contrarian investor, this comes naturally to me. I often favor stocks the most when the ten or so sentiment indicators I track are exceptionally bearish (a bullish signal in the contrarian sense).
Excerpts of Brush Up on Stocks macro commentary during the 2020 bear market:
“This is one of those buying opportunities that only comes along rarely in life.”
“Please try to take advantage of it by putting money into the markets now. Or if you are fully long, please avoid getting shaken out by panic, which is now more contagious than Covid-19.”
“The bottom line on the markets is this. Sentiment continues to be very dark. Insiders continue to be very bullish. The media continue to be very negative, and they regularly spread misinformation to be more negative and sensational. As a general rule, this trio of signals lined up in this way has almost always been a great buy signal for stocks, and I believe that is the case now.”
“It’s during these really dark moments that it makes the most sense to buy. You don’t get many of them in life, so it makes sense to take advantage of this one now if you can.”
“As Seth Klarman of the Baupost Group purportedly once said: ‘Buying and selling right never feels good.’”
“All market crises feel like they are the end of the world when you are going through them. The bottom line: If you have buying power use it. If you have margin capability, use it, with caution. If you are long and scared with no buying power, be careful not to panic sell here.”
“Some time from now, maybe six months, maybe a year, you will be quite happy that you bought stocks today or yesterday or tomorrow, or you will be happy you did not get shaken out.”
“Continue to be bullish on stocks and particularly favor the sectors getting hit the hardest that insiders also like, such as public gathering place stocks, industrials, and basic materials stocks in areas like chemicals and energy.”
“We may not get at the exact bottom. But six to twelve months from now you will probably be glad that you acted in concert with insiders.”
The big picture
A few years after I started this letter in June 2010, I decided to examine my record to see if my stock selection system really works (otherwise, why bother). In 2014 I took a comprehensive look at the performance of all stocks ever suggested in my stock letter during the first four years. The results show my stocks beat the market, on the whole.
Here’s an executive summary, from 2014, followed by a more detailed analysis with charts. (I haven’t repeated this analysis for subsequent years. I will at some point. Four years worth of stock selections is a good sample size, though, to say the least.)
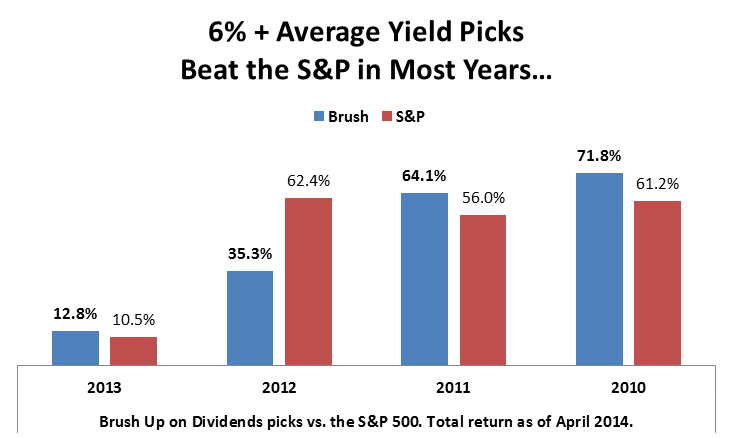
* My stock picks beat the S&P 500 each of the past four years. In contrast, about 70% of professional money managers regularly underperform the market.
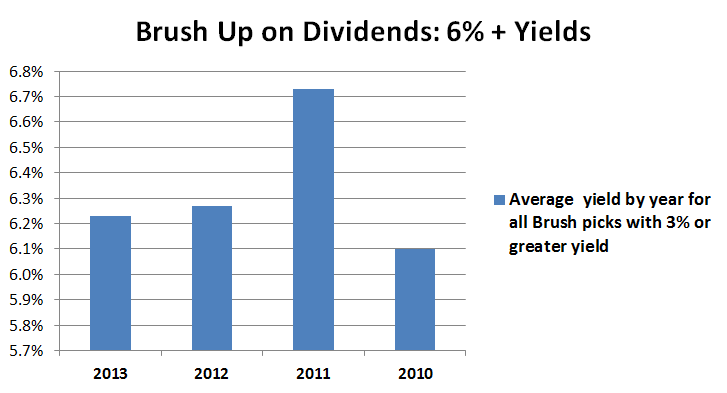
* Dividend picks paid an average of 6% plus yield in each of the past four years. They beat the S&P 500 in three of the past four years for total return (yield plus stock appreciation).
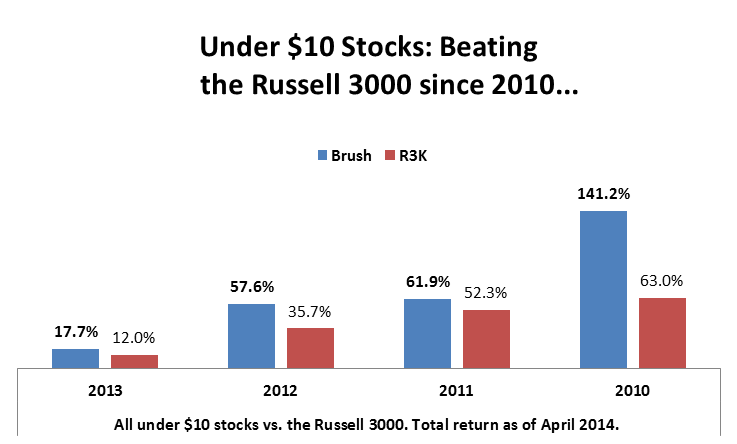
* Under $10 stocks beat the Russell 3000 each of the past four years.
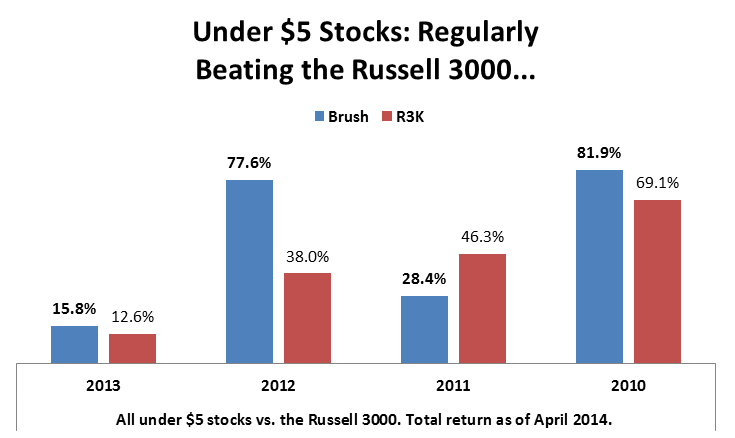
* Under $5 stocks beat the Russell 3000 in three of the past four years.
* No single monthly letter produced losses.
The following charts show the performance of all Brush Up on Stocks picks (no cherry picking!) compared to similar S&P 500 purchases. Please note S&P 500 performance below is lower than the annual performance you may normally see cited for each year. That’s because S&P purchases, to match my stock suggestions, were spread throughout the year in a rising market. Results assume simple buy and hold (as suggested).
Brush Up on Stocks

Brush Up on Dividends
Under $10 Stocks
Under $5 stocks
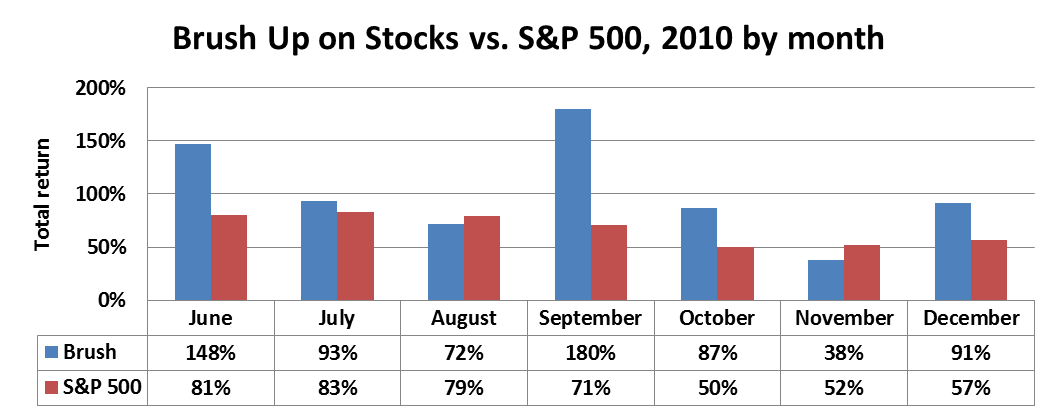
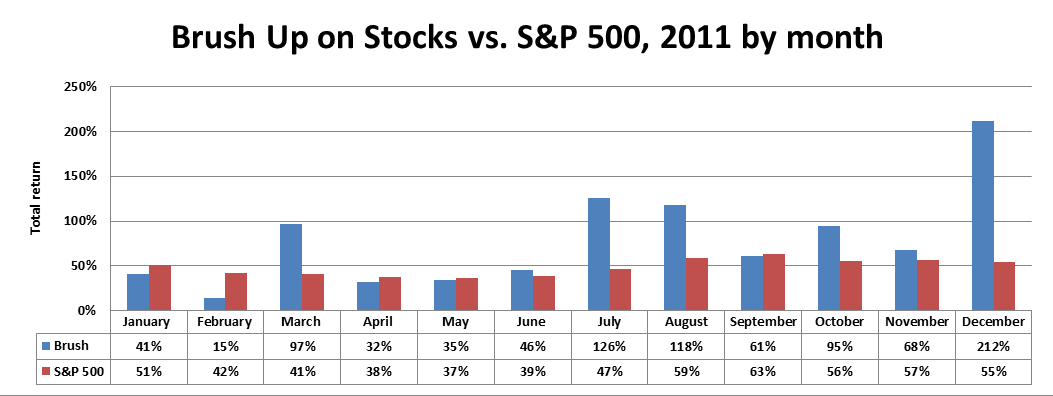
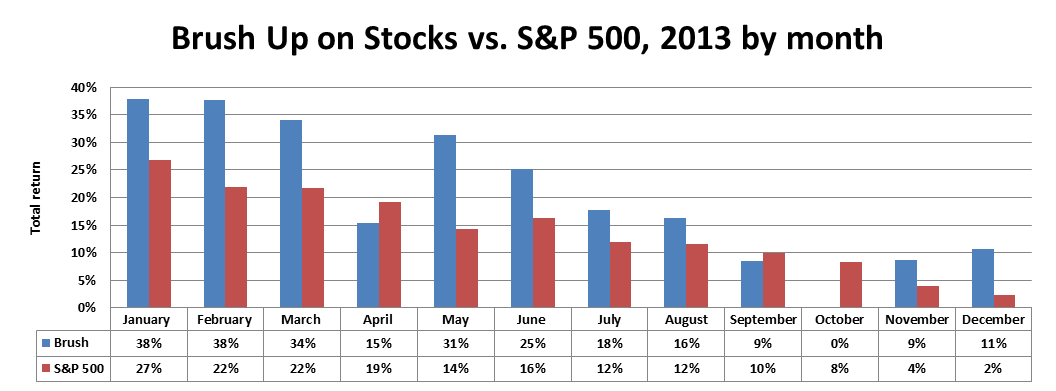
Performance by month
* Since inception, I’ve outperformed 72% of the time: 31 out of 43 months.
* 29% of the time (12 out of 43 months) I beat the market by over 30 percentage points.
* Twelve months outperformed by about twice as much, or more.
* No losses: No monthly letter picks produced losses.
The following charts show how you would have done buying all the stocks in each month of my letter vs. comparable purchases of the S&P 500.

Options
As of December 31, 2013 Brush Up on Stocks had suggested 230 options trades that were completely successful and profitable, two that were partially successful, and two that were unprofitable.
Explanation of overall performance methodology
Unfortunately, many stock newsletters use tricks to try to fool you into thinking they have great results. Don’t be fooled.
One common trick you should look out for is cherry picking. Some stock newsletter marketers will tell you about the few picks that did really well, but leave out their turkeys. The problem is, at the time of the recommendations, you wouldn’t know which was which.
Another trick is to compare newsletter results against a market benchmark, leaving out dividends. This is very misleading, since over time dividends account for 40% of market return! It’s not much better to leave out dividends on both sides (for the letter and the benchmark), since only by chance would the dividends on each side be equal.
When I present my results, I include all stock suggestions of mine, and I include dividends on both sides.
Because I am a stock analyst and not a portfolio manager, I compare my stock picks against equal size positions of my market benchmark, purchased at the same time.
Since I’m a stock analyst, I believe using one-to-one comparisons throughout the year (a market position added each time I add a stock) is the best way to assess my record.
For Brush Up on Stocks and dividend picks, I compare my selections offered throughout a month against market positions purchased at the mid-point price for the same month. For under $10 and under $5 names, I compare my picks against market positions purchased on the same day.
I compare Brush Up on Stocks and dividend picks to the S&P 500 ETF (SPY). I compare performance of under $10 and under $5 names to the Russell 3000 ETF (IWV). I assume a simple buy and hold for all names, as suggested in the newsletters. To avoid benefiting from any positive impact that publication of my suggestions may have on price, I use the midpoint price over the three days following my stock suggestion, for stock entry prices.
In the event of a buyout, I move proceeds to cash and leave them there, assuming no interest earnings. I move a comparable benchmark position to cash at the time of the takeover.
I compare my picks to comparable market benchmark positions purchased whenever I suggest a stock, because I am a stock analyst and not a portfolio manager.
I ask subscribers to consider me as a stock analyst as part of their team or resource base. Thus one-to-one comparisons of my picks against benchmark positions is the purest way to judge my value add via stock suggestions.
Performance numbers are as of the end of April, 2014.
Anecdotal examples
Anecdotal examples are fun. Keeping in mind that they are purely anecdotal, here are examples of market and stock calls during 2016.
* 9% in 24 hours
A swing trade highlighted at 2 pm May 9 was up 4% by the close, and 9% May 10.
* 13% in a day; 32% in four trading days
An energy stock singled out and highlighted May 4 was up 13% by the close on May 5, and 32% by May 10.
The Brush Energy Eight select energy stocks, also suggested May 4, were up 4.7% by the close May 5.
In contrast, the energy ETF XLE was up 1.6% and the S&P 500 ETF SPY was up 0.46%.
* Five stocks, 17 days, 16% gains vs. 1.8% for the S&P 500
The five main stocks suggested in the April 10, 2017 issue advanced 16% by April 28. The S&P 500 was up 1.8%. My five suggestions were up 31.7%, 18.8%, 10.5%, 10% and 9.2%. This group excludes specialized yield and under $5 suggestions. Including those five names, all stocks from the April 10 issue were up 9.4% compared to 1.8% for the market.
* 20%-30% gains in a month
A stock highlighted on March 15 and reiterated on April 10 was up 20%-30% by April 13.
* 10% gains in four hours
A trade/buy and hold name suggested mid-day March 17 was up 10% by the close.
Reader comment: “I bought [stock XYZ] this morning after receiving your BUOS update and it’s up 10% at market close. I’ve made about 30k since signing up, so am quite pleased. Good work sir!” – VP in TX
* The Brush Biotech 15 portfolio (buy and hold) is up 3x-5x the IBB in 14 months
The eight larger cap names in the Brush Biotech 15 portfolio (introduced January 26, 2016) were up 48.8% as of mid March 2017, or almost five times the 10.5% return for the iShares NASDAQ Biotech ETF (IBB). The entire Brush Biotech 15, including the seven names that started with market caps below $500 million, was up 32.7%. That’s about three times the 10.5% return for the IBB.
* 18%-25% in two trading days
A stock I singled out as a buy on March 9 was up as much as 25% and closed up 18.5% in two trading days.
* 27% in two trading days
A stock I singled out in a special update February 16 was up 27% in two trading days.
* 20% in 24 hours; 78% in a week
A stock I suggested buying February 14 in a special update, because of an unwarranted selloff, was up 20% in 24 hours, and 78% in six trading days.
* 15% gains in three weeks
A large cap swing trade I highlighted on January 20, 2017 was up 15% by February 10.
* 16% gains in an afternoon; 102% gains in a year
A swing trade I suggested at mid-day January 9, 2017 was up 16% by the end of the day. This stock, a long term holding and a regular trading position, is up 102% since I reiterated it on February 11, 2016; 109% since I reiterated it on March 22, 2016; 78% since I reiterated it on January 20, 2016; and 37% since I reiterated it on October 11, 2016. It is up 78% since I introduced it in my stock letter in May 2014.
* 400% gains in a year
Ariad Pharmaceuticals (ARIA) was up 72.8% January 9, 2017 on news it is being bought out by Takeda, a Japanese pharmaceutical company.
ARIA is up 277% since I introduced it in my stock letter in January 2015, mentioning it as a buyout candidate at the time. It is up 400% since I reiterated it on February 7, 2016, and 249% since I reiterated it on February 11, 2015.
I believe 2017 may be the year of the biotech takeover since big biotech and pharmaceutical companies have lots of cash but sparse drug pipelines. Any repatriation of funds under tax reform introduced by Donald Trump should also help, since big biotech and large pharmaceutical companies have lots of cash abroad. I believe at least a half a dozen biotech suggestions in Brush Up on Stocks are potential buyout candidates.
* 812% gains in five years
Incyte (INCY), one of my favorite biotech stocks, was up 10% January 9, 2017 on news that it is broadly expanding its partnership with Merck (MRK) in cancer drug development.
Incyte is up 812% since I first suggested it on December 8, 2011. It is up 77%-78% since I reiterated it on January 28, 2016 and March 24 2016. And it is up 33% since I reiterated it on October 13, 2016. I consider the stock to be more of a hold than a buy at current levels, though I am not trimming positions.
* 9%-30% gains in eight trading days
Three recent swing trades in biotech did exceptionally well. One singled out on December 27 netted 9.6% gains in seven trading days. Related short put sales are up almost 100%. Another highlighted on December 23, 2016 netted 15%-20% gains in eight trading days. A third highlighted on November 23, 2016 and December 22, 2016 netted 18%-30% in 8-32 trading days.
* 53.3% gains in five months vs. 9.3% for the S&P 500
Back in June, 2016, the market was panicked about Brexit. My own analysis showed that the economic damage to the U.S. and Europe from Brexit would not be so bad. I suggested ten equities to buy as a contrarian play, when most people were selling. Within two days, those ten names were up 11% vs. 5.2% for the S&P 500. By the middle of November, my ten picks were up 55.3% compared to 9.3% for the S&P 500.
* 29.6% gains vs. 1.53% for the S&P 500 in less than four months
On July 31, 2016 my system put out a strong buy signal on the banking sector. I suggested five banks to subscribers. By November 21, they were up 29.6% compared to 1.53% for the S&P 500. Plus they all kicked out dividends along the way. The five yielded around 2% at the time, on average.
* 22 percentage points of outperformance in a month
On October 13 I asked my subscribers to buy biotech as a contrarian play because the group was so disliked. I suggested the five biotech stocks that came up the strongest in my system. By November 17 they delivered 22 percentage points of outperformance. They were up 25.3% vs. 2.6% for the market (SPY) and 7.4% for biotech overall (the IBB).
* 27.8% gains in three months vs. 0.3% for the S&P 500 (plus an unwitting nod from Warren Buffett)
In early August I suggested airline stocks which suddenly ranked high in my system. By mid-November they were up 27.8% compared to 0.3% for the S&P 500. Later, we learned that Warren Buffett was buying airlines around the same time my system favored them.
* 18 percentage point market outperformance in three weeks
On October 24 I wrote that “Biotech sentiment has turned particularly sour, suggesting it is a good time to ramp up buying there.” I singled out three prior suggestions and introduced two new ones. Within three weeks those five names were up 20% compared to 1.6% for the market (SPY) and 7.2% for the sector (IBB). The five stocks were up 7.3% to 29.7%.
* 4%-5% market gains in two weeks
On November 1 I noted that stocks overall were starting to look more buyable because sentiment was turning negative. I offered one simple publicly available indicator as a guide to the best time to buy. That indicator triggered on November 2 and 3. Subscribers who bought the broad markets on those dates were up 4%-5% in two weeks.
* Brush Biotech 15 model portfolio (buy and hold) 3x-7x the IBB
The eight larger cap (and theoretically safer) names in the Brush Biotech 15 model portfolio (introduced January 26, 2016) were up 44% as of November 17, 2016, or 7.3 times as much as the 6% return for the IBB. The entire Brush Biotech 15, including the seven riskier names that started with market caps below $500 million, were up 17%, or nearly three times the 6% return for the IBB.
From the vault: Online columns beating the markets
During 1998-2013 I wrote a weekly investment column for MSN, which was the second or third biggest website by traffic for much of that time. During my last year there, I took a look back over two years to study how my column suggestions did.
Two thirds of my stock investing columns at MSN Money beat the market.* Here’s a sampling of online columns that beat the market. Results use the closing price from the day after publication. Results are tallied through the end of April, 2014 unless otherwise noted.
4/2/2013: Facebook will have the last laugh
Facebook (FB) advanced 128% vs. 23.7% for the S&P 500
5/8/2012: Facebook’s hot but Google’s cheaper
Google (GOOG) was up 100% within 22 months of this May 8, 2012 column, compared to 42% gains for the S&P 500
7/17/12: 8 great stocks for less than $5
These eight under $5 stocks were up 79.3% vs. 43.6% for the Russell 3000 (OPAY, AHC, PT, HERO, WGA, FCH, NM, PSUN)
4/23/2013: 10 red-hot growth companies for 2014
These ten stocks advanced 60.3% vs. 21.7% for the S&P 500 (YELP, TSLA, KEYW, BDE, KBH, EXP, TRLA, BCEI, STNG, SNTS)
9/18/2012: Are Facebook and its brethren buys
These three social media stocks were up 59% vs. 33.2% for the S&P 500 (FB ANGI LNKD mentioned positively)
9/4/2012: 7 tech stocks for income investors
The seven tech stocks in this column advanced 55.8% vs. 38.6% for the S&P 500 (INTC MSFT TXN HPQ AMAT MCHP ISIL)
5/14/2012: 6 companies poised to raise prices
The six companies suggested in this column advanced 55.5% compared to 47.2% for the S&P 500 (DIS LO UNP NVS DEO AAPL)
10/31/2012: 8 zombie stocks that could awaken
The eight stocks in this column advanced 50.4% vs. 36% for the S&P 500 (NTDOY RIMM ZNGA YHOO TLAB KLIC ESIO FB)
5/22/2012: 5 companies where investors come first
These five companies advanced 54% compared to 48.5% for the S&P 500 (COST UNH GPS SYY AMCC)
5/22/2013: 12 hot stocks just hitting the market
These 11 IPO names were up 52.5% by the end of February 2014 vs. 15.7% for the S&P 500. They were up 30.6% vs. 16.6% by the end of April 2014. One of the IPOs featured was so attractive, it got bought out before it could come public (ECOM, MKTO, DATA, HDS, PGEM, BRSS, TMHC, RCPT, RCAP, TEP, AHH, and Bausch + Lomb bought before it came public)
3/6/12: 5 Top Stocks Under $5
These five under $5 names were up 52% vs. 45.9% for the Russell 3000 (CMRG, VVTV, ETAK, GSL, FBP)
7/24/2012: Quality stocks with solid dividends
The seven stocks in this column advanced 49.5% compared to 45.8% for the S&P 500 (DPS LMT VOD MCHP DO SSW K)
12/21/2012: 8 dirt-cheap tech stocks
The eight stocks in this column advanced 47.5% vs. 35.5% for the S&P 500 (INTC GOOG MSFT EA EMC STX CTSH ATML)
8/7/2012: 7 companies bitten by the Euro bug
These seven companies advanced 45.6% compared to 39% for the S&P 500 (MCD ANF K SBUX GM HOG CCL)
10/2/2012: 5 stocks to buy on Europe’s woes
The five stocks in this column advanced 39.2% vs. 33.9% for the S&P 500 (NSRGY VOLVY AHONY SNY SBGSY)
8/13/2013: Time to pick up a newspaper stock?
These seven stocks advanced 28.8% vs. 13.2% for the S&P 500 (NYT, NWSA, GCI, TRBAA, SSP, LEE, AHC)
4/16/2013: It’s time for the big bank payback
These six stocks advanced 28.7% vs. 23.8% for the S&P 500 (C BAC JPM COF STI RF)
2/26/2013: 8 jolly giants that are cheap
These stocks advanced 27.8% vs. 27% for the S&P 500 (GE QCOM UTX BRK.B GOOG ORCL JPM MSFT)
9/3/2013: 4 reasons to invest in Europe — really
These ten stocks advanced 26.8% vs. 15.3% for the S&P 500 (WPPGY, TOT, NVS, SNY, BNPQY, ISNPY, ING, AEG, AKZOY, AXAHY)
5/28/2013: 13 energy stocks ready to roll
These 13 stocks advanced 22.8% vs. 16.3% for the S&P 500 (APA, DVN, RDS.B, HK, EOG, CLR, UPL, WPX, NOV, HAL, WFT, ATW, CMLP)
5/9/2013: 10 companies buying their own stock
These ten companies were up 20.3% vs. 17.6% for the S&P 500 (AAPL, HD, MRK, GE, PEP, UPS, AXP, LOW, MMM, QCOM)
*For my sample, I looked at the latest 70 columns of mine at MSN Money. Of those, 32 were investment columns, and 21 of those (two thirds) outperformed the markets. I used the SPY to calculate S&P 500 benchmark returns, and the IWV to calculate Russell 3000 benchmark returns. Dividends included for both columns and benchmarks.